Data-Driven Dynamics: How Analytics Are Revolutionizing Vehicle Maintenance Success

Understanding the Challenge
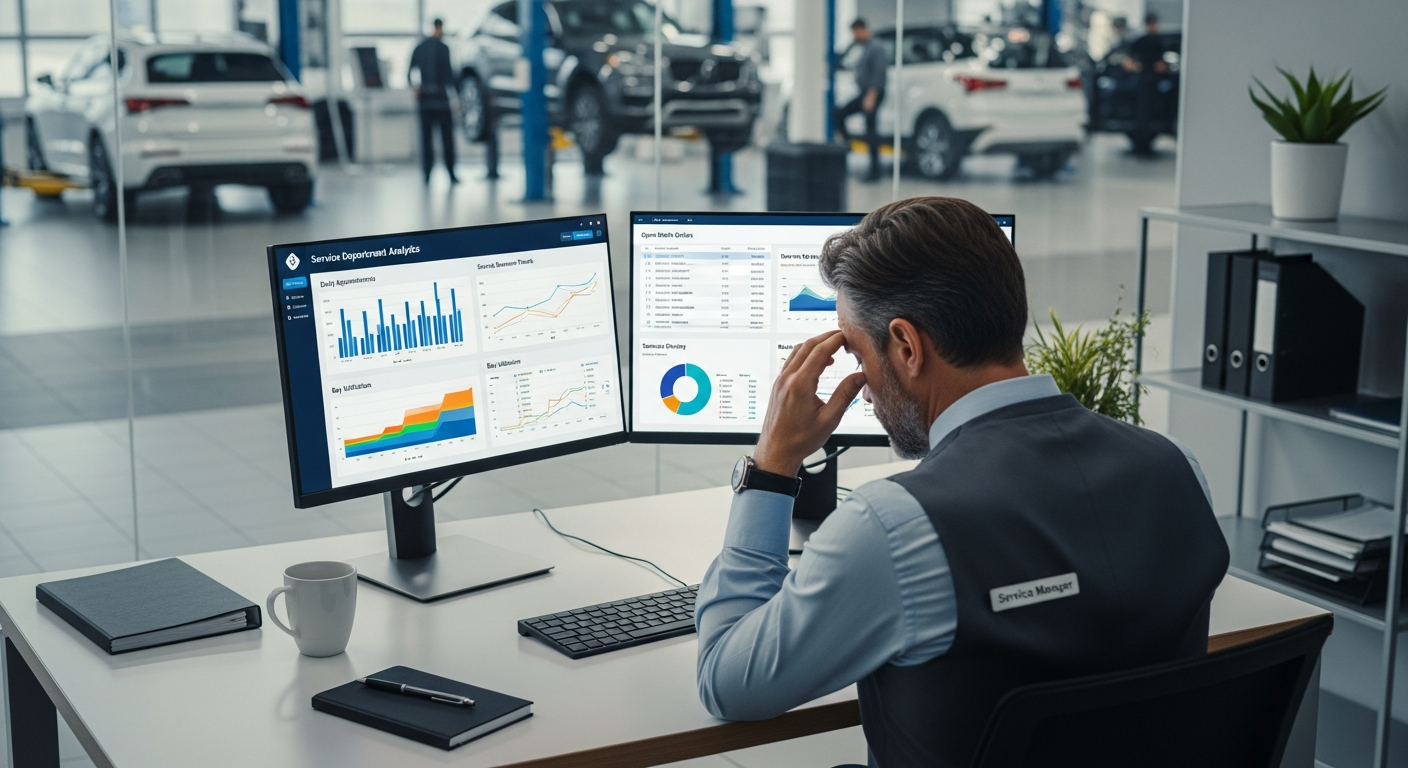
In today's data-driven world, service departments are inundated with information from multiple sources. From the dealership management system (DMS) to customer relationship management (CRM) tools and service scheduling systems, the volume of data can be overwhelming. Service managers are often left scratching their heads, trying to make sense of conflicting reports and metrics.
The root of the problem lies in the siloed nature of these data sources. Without a unified platform, it becomes nearly impossible to extract actionable insights. For instance, while one system may highlight technician utilization rates, another may focus on customer satisfaction metrics, leaving managers to piece together a cohesive strategy.
Moreover, the lack of standardized definitions and formulas for key metrics like technician efficiency, shop capacity optimization, and hours per repair order (HPRO) further complicates the situation. This inconsistency not only hampers decision-making but also makes it difficult to benchmark performance against industry standards.
To add to the complexity, evolving data-access regulations, such as the Right to Repair Act, introduce new challenges in terms of data governance and ownership. Service departments need to navigate this shifting landscape while ensuring compliance and protecting customer data.
Given these challenges, it's no surprise that many service departments are unable to fully leverage their data for improved profitability and operational efficiency. However, with the right approach, these obstacles can be transformed into opportunities for growth.
Current Industry Landscape
The automotive service industry is undergoing a significant transformation, driven by technological advancements and shifting consumer expectations. In recent years, there's been a noticeable shift towards digital solutions, with tools like Cox Automotive's Xtime and Tekion's Automotive Retail Cloud leading the charge.
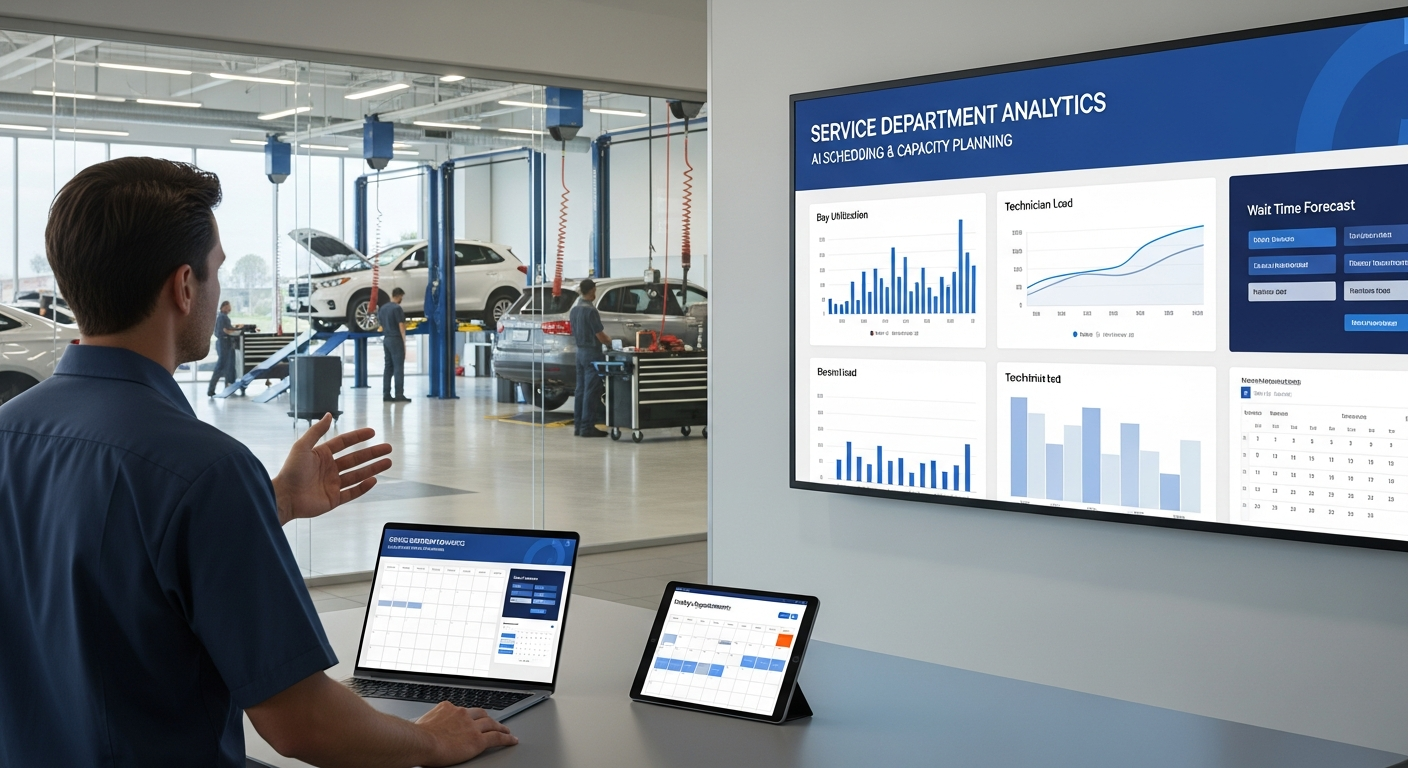
These platforms offer integrated solutions that unify various data points, providing service managers with a comprehensive view of their operations. By centralizing data from the DMS, CRM, scheduling, and CDP systems, these tools enable better decision-making and strategic planning.
One of the most significant trends in the industry is the adoption of artificial intelligence (AI) in service scheduling and capacity planning. With AI schedulers, dealerships can optimize bay utilization, reduce no-shows, and streamline appointment lead times, ultimately improving profitability and customer satisfaction.
Furthermore, the rise of electric vehicles (EVs) presents both challenges and opportunities for service departments. As the EV market grows, there's a need to adapt analytics and training to address unique servicing requirements, such as tooling and warranty mix.
To remain competitive, dealerships must stay abreast of these trends and invest in the right technologies. By doing so, they can not only enhance operational efficiency but also deliver a superior customer experience.
The Solution Framework
To effectively harness the power of fixed ops analytics, service departments need a structured approach that integrates data from multiple sources. The first step in building a robust analytics framework is to establish a single source of truth, unifying data from DMS, CRM, scheduler, MPI, and CDP systems.
This can be achieved through platforms that offer open APIs and contractual data egress, ensuring data ownership and governance. By standardizing event schemas and data freshness SLAs, service departments can maintain data integrity and accuracy.
Once a unified platform is in place, the next step is to define clear KPIs and performance metrics. These should be aligned with the dealership's strategic goals and include benchmarks for service absorption, first-time fix rate (FRFT), technician utilization, and more.
Equally important is the implementation of dynamic pricing models that enhance revenue while maintaining customer trust. By setting caps, bands, and fairness rules, service departments can avoid backlash and ensure compliance with OEM constraints.
Ultimately, a well-executed analytics framework empowers service managers to make informed decisions, optimize operations, and drive profitability.
Implementation Guide
Implementing an effective analytics strategy requires careful planning and execution. The first step is to conduct a thorough assessment of your current data infrastructure, identifying any gaps or silos that need to be addressed.
Next, work with your IT team and chosen technology partners to integrate data across platforms, ensuring seamless data flow and synchronization. Establish data governance policies to maintain data quality and compliance with regulations.
Training and change management are critical components of the implementation process. Service managers should invest in training programs to upskill technicians and advisors on new tools and processes, ensuring a smooth transition.
To incentivize adoption, consider implementing performance-based rewards for technicians who leverage analytics to improve efficiency and customer satisfaction. Regularly review performance metrics to track progress and make necessary adjustments.
Finally, establish a continuous improvement cycle, using analytics insights to refine processes, enhance services, and drive ongoing growth.
Measuring Success
Success in service department analytics is measured through a set of carefully selected KPIs that reflect the department's operational and financial health. The most critical of these include the first-time fix rate (FRFT), service absorption rate, and technician utilization.
An FRFT of 90% or higher indicates effective diagnostics and repairs, reducing rework and enhancing customer satisfaction. Meanwhile, a service absorption rate of 70% demonstrates the department's ability to cover its overheads through its own revenues, a key profitability indicator.
Technician utilization, ideally between 85% to 90%, reflects efficient use of labor resources, balancing workload without overburdening staff. This metric is crucial for maintaining staff satisfaction and retention.
To gauge the impact of new strategies, dealerships should also track incremental improvements in appointment lead times, no-show rates, and customer retention. By consistently monitoring these KPIs, service managers can make informed adjustments, ensuring sustained growth and profitability.
It's important to remember that each dealership may have unique goals and challenges, so KPIs should be tailored to fit specific needs and objectives.
Advanced Strategies
Once the foundational analytics framework is in place, service departments can explore advanced strategies to further enhance their operations. One such strategy is the use of predictive analytics to anticipate service needs and optimize inventory management.
By analyzing historical data and customer trends, dealerships can forecast demand, ensuring they have the right parts and resources on hand to meet customer needs promptly. This not only improves service efficiency but also enhances customer satisfaction.
Another area of opportunity is the integration of AI-driven customer engagement tools. These can personalize communications, streamline approvals, and reduce no-show rates, leading to increased operational efficiency and profitability.
Dealerships should also consider expanding their analytics capabilities to include sales retention and lifetime value metrics, linking service performance to overall business growth. By understanding the full customer journey, service managers can identify cross-selling opportunities and enhance customer loyalty.
Finally, scalability is key. As your analytics efforts grow, ensure that your infrastructure can support increased data volumes and complexity. Regularly review and update your systems to keep pace with technological advancements and industry trends.
Related Topics
Ready to take your service department to the next level?
Schedule your demo today and experience the power of Auto Pro Solutions.
Schedule Demo